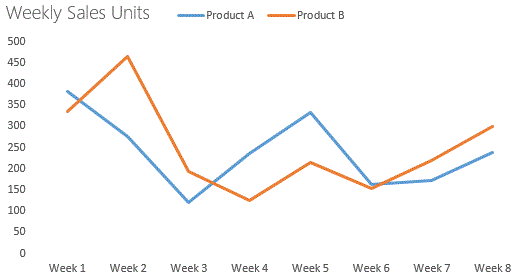
The line chart is a common well-known graph in many fields, also label as line graph. It is a graph that is used to display information on connection points. These points are connected through a continuous or straight line. The line graph is the extension of the scatters plot, Datapoints can be represented by icons of symbols, of can also draw the simple line without icons. The line chart show tendency in the data set and illustrate the data behavior with the passage of time or over a specific interval of time.
 |
| Simple Line Chart with the symbolic data point |
 |
| Simple Line Chart |
There are many forms of variations of the line chart or line graph, depends on the data points to be the plot, for example -step line chart, curve line chart, vertical segment line chart, horizontal segment line chart, reverse step line chart.


No comments:
Post a Comment